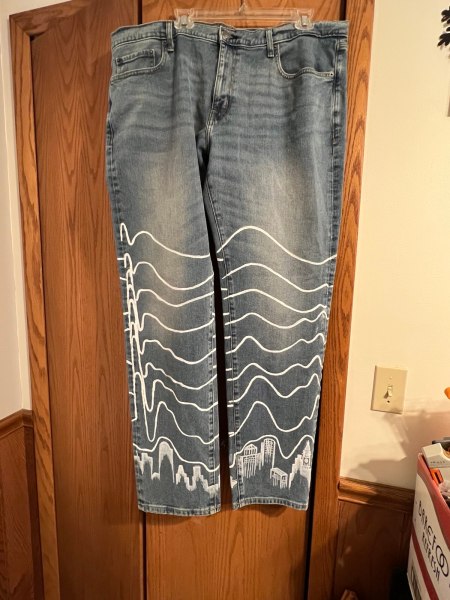
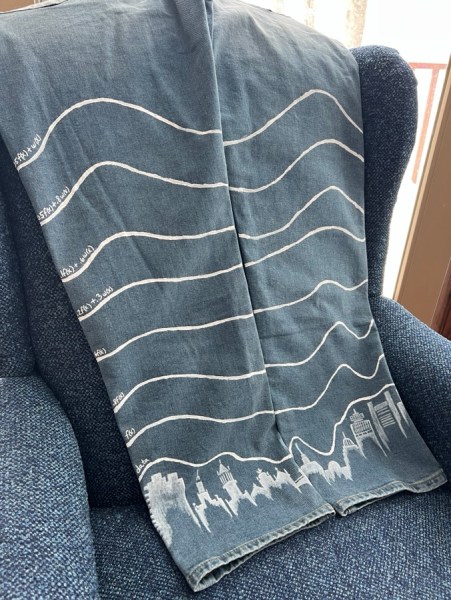
These pants have been hanging around…. for a looong time (like years)… and they are finally done and shipped!!! At first, it was a gap in communication… and now it’s a me thing. I had this idea to map an equation onto a set of data points collected by marking the tops of buildings in the iconic Boston skyline. (Fun fact: I had my students do a similar project – creating a function to map an aspect of a photo using a regression line, mostly quadratic functions.) From there, I wanted to morph the function into a more well-known function like a sine function or something. In my brain, there’s a picture of several related equations graphed vertically from each other that change in steps from one to the next – either showing more “noise” or less… or something like that. Such a vague idea, right? I polled the populations of my mathematically-brained friends and collected some ideas of how to proceed. Well, of course, even before I knew I could figure it out mathematically, I committed myself to this idea by not only painting the skyline onto the pants, but also marking out the “data line” in pen. Good job, Julie. Go big or go home.


Well, with some help from nerd-sniping Joshy, Brad, and Marielle, I finally figured out how to bring my dream to its mathematically sound fruition! (Thanks peeps!!) I did consider just free-handing the “functions” and not actually having the math to back it up, though that would be a significant deviation from the way I have created the rest of my items for Osa. This turned into the primary reason for the delay (I even completed 4 other pairs of shoes for Osa in the meantime… guh, Julie, procrastination at its finest.).
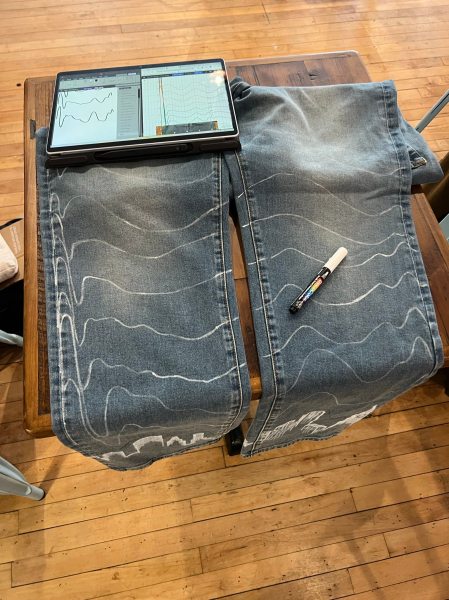
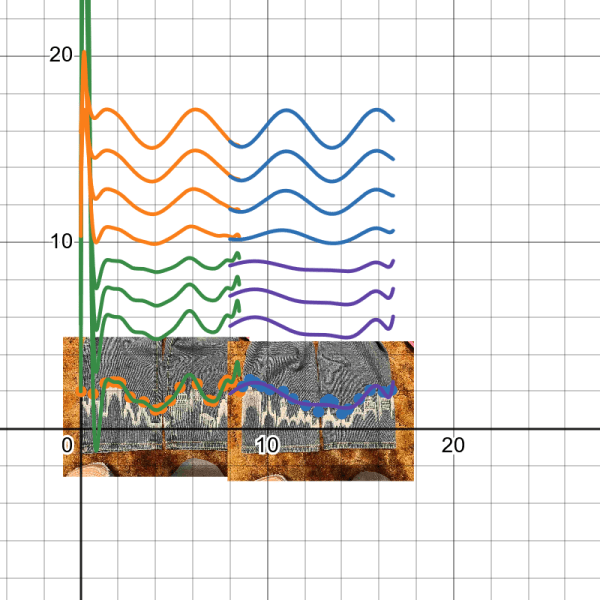
In the end, I over-powered the regression equation – basically a Taylor Series – and then plotted functions vertically of different percentages of the original regression and a transformed sine function that mapped to the skyline in a vague way – just like I’d hoped! See the Desmos.com graph shown below. Click to follow the link and to see all of the equations. Feel free to play with the file! Don’t worry, you can’t make lasting changes to my original graph by playing with it.
(Not sponsored just love it) Desmos is one of my favorite online graphing platforms. I used it all the time as a high school math teacher, repped my hard-won “I heart Desmos” tshirt often, and secretly hope I end up working with/for them one day.
Aesthetically, I chose all white for these pants. My other jeans have been loud in terms of color… and pattern, let’s be real, and I decided to go for a more subdued look color-wise. I used acrylic paint with a fabric additive and DecoColor Paint pens rather than bleach.
Fun, right??